Bali as a Strategic Assetin Your Global Portfolio
We build liquidity portfolios backed by 37,000+ Airbnb listing analytics. Our managed properties consistently perform in the top 10%.
Not All Brokers Are Created Equal
Most promise returns. We engineer them
- Promises 20% ROI on paper
- Renders without market analysis
- No accountability after the deal
- Result: underperformance
- Revenue projections based on Data Science
- Full Due Diligence before every listing
- In-house Property Management
- Result: top-10% market performance
What's Your Investment Goal?
Different objectives demand different strategies. We tailor each portfolio to your specific need

Maximize Yield with Data-Driven Short-Term Rental
Properties positioned in the epicenter of tourism flow. Algorithmically priced, professionally managed, and designed for maximum occupancy
- 85%+ average occupancy rate
- 6–7 year payback period
- Net yield from 12% annually
- Daily pricing optimization via AI
Numbers, Not Promises
Real results from real investments. Every case backed by data
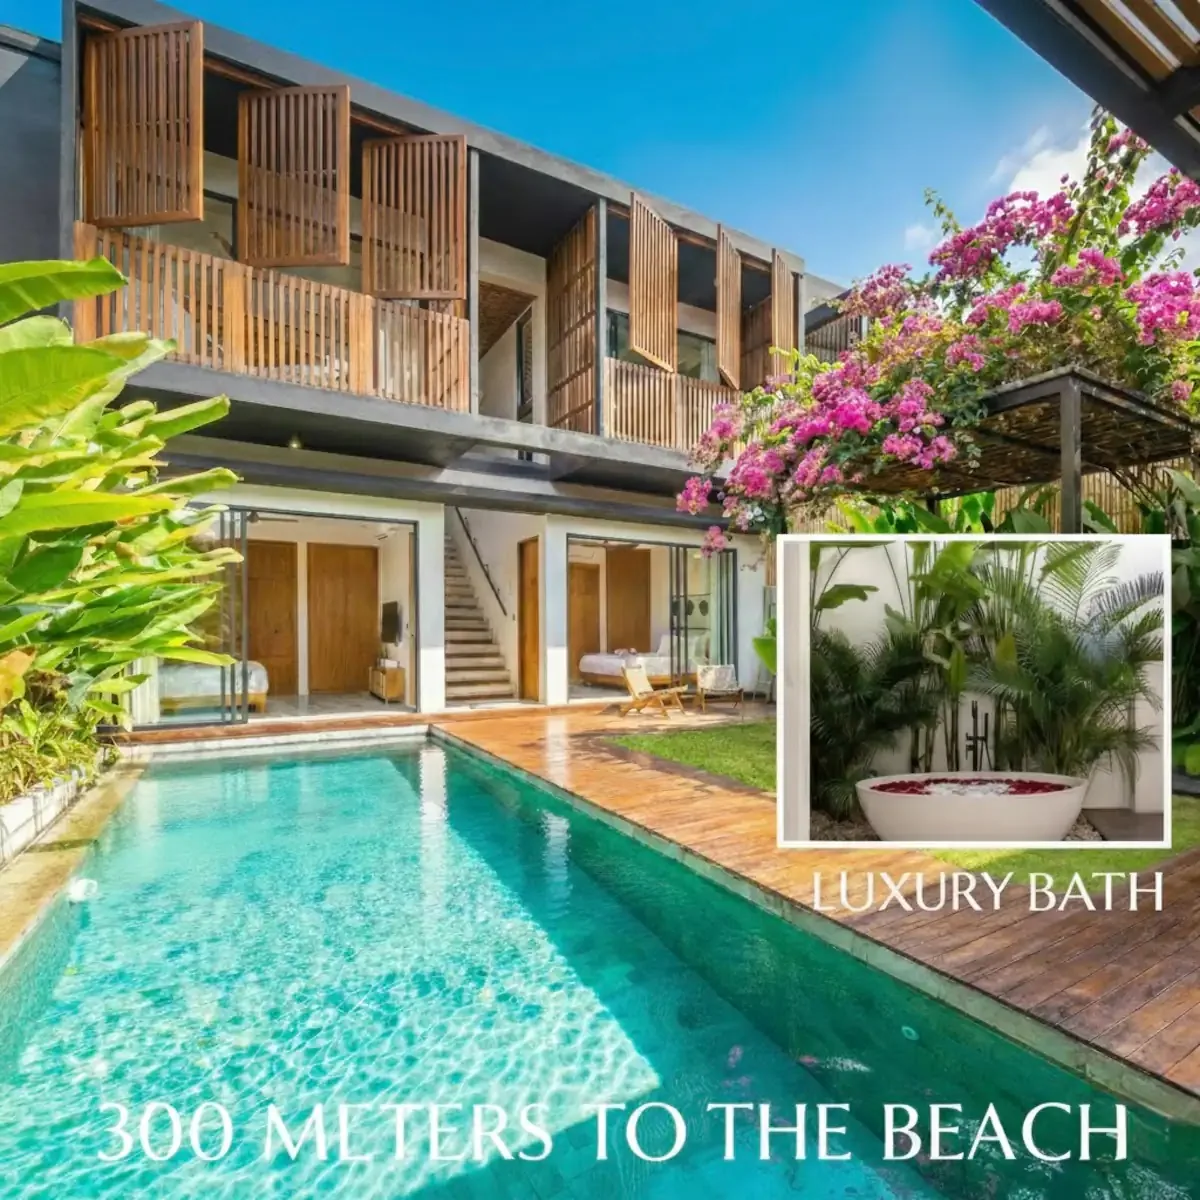
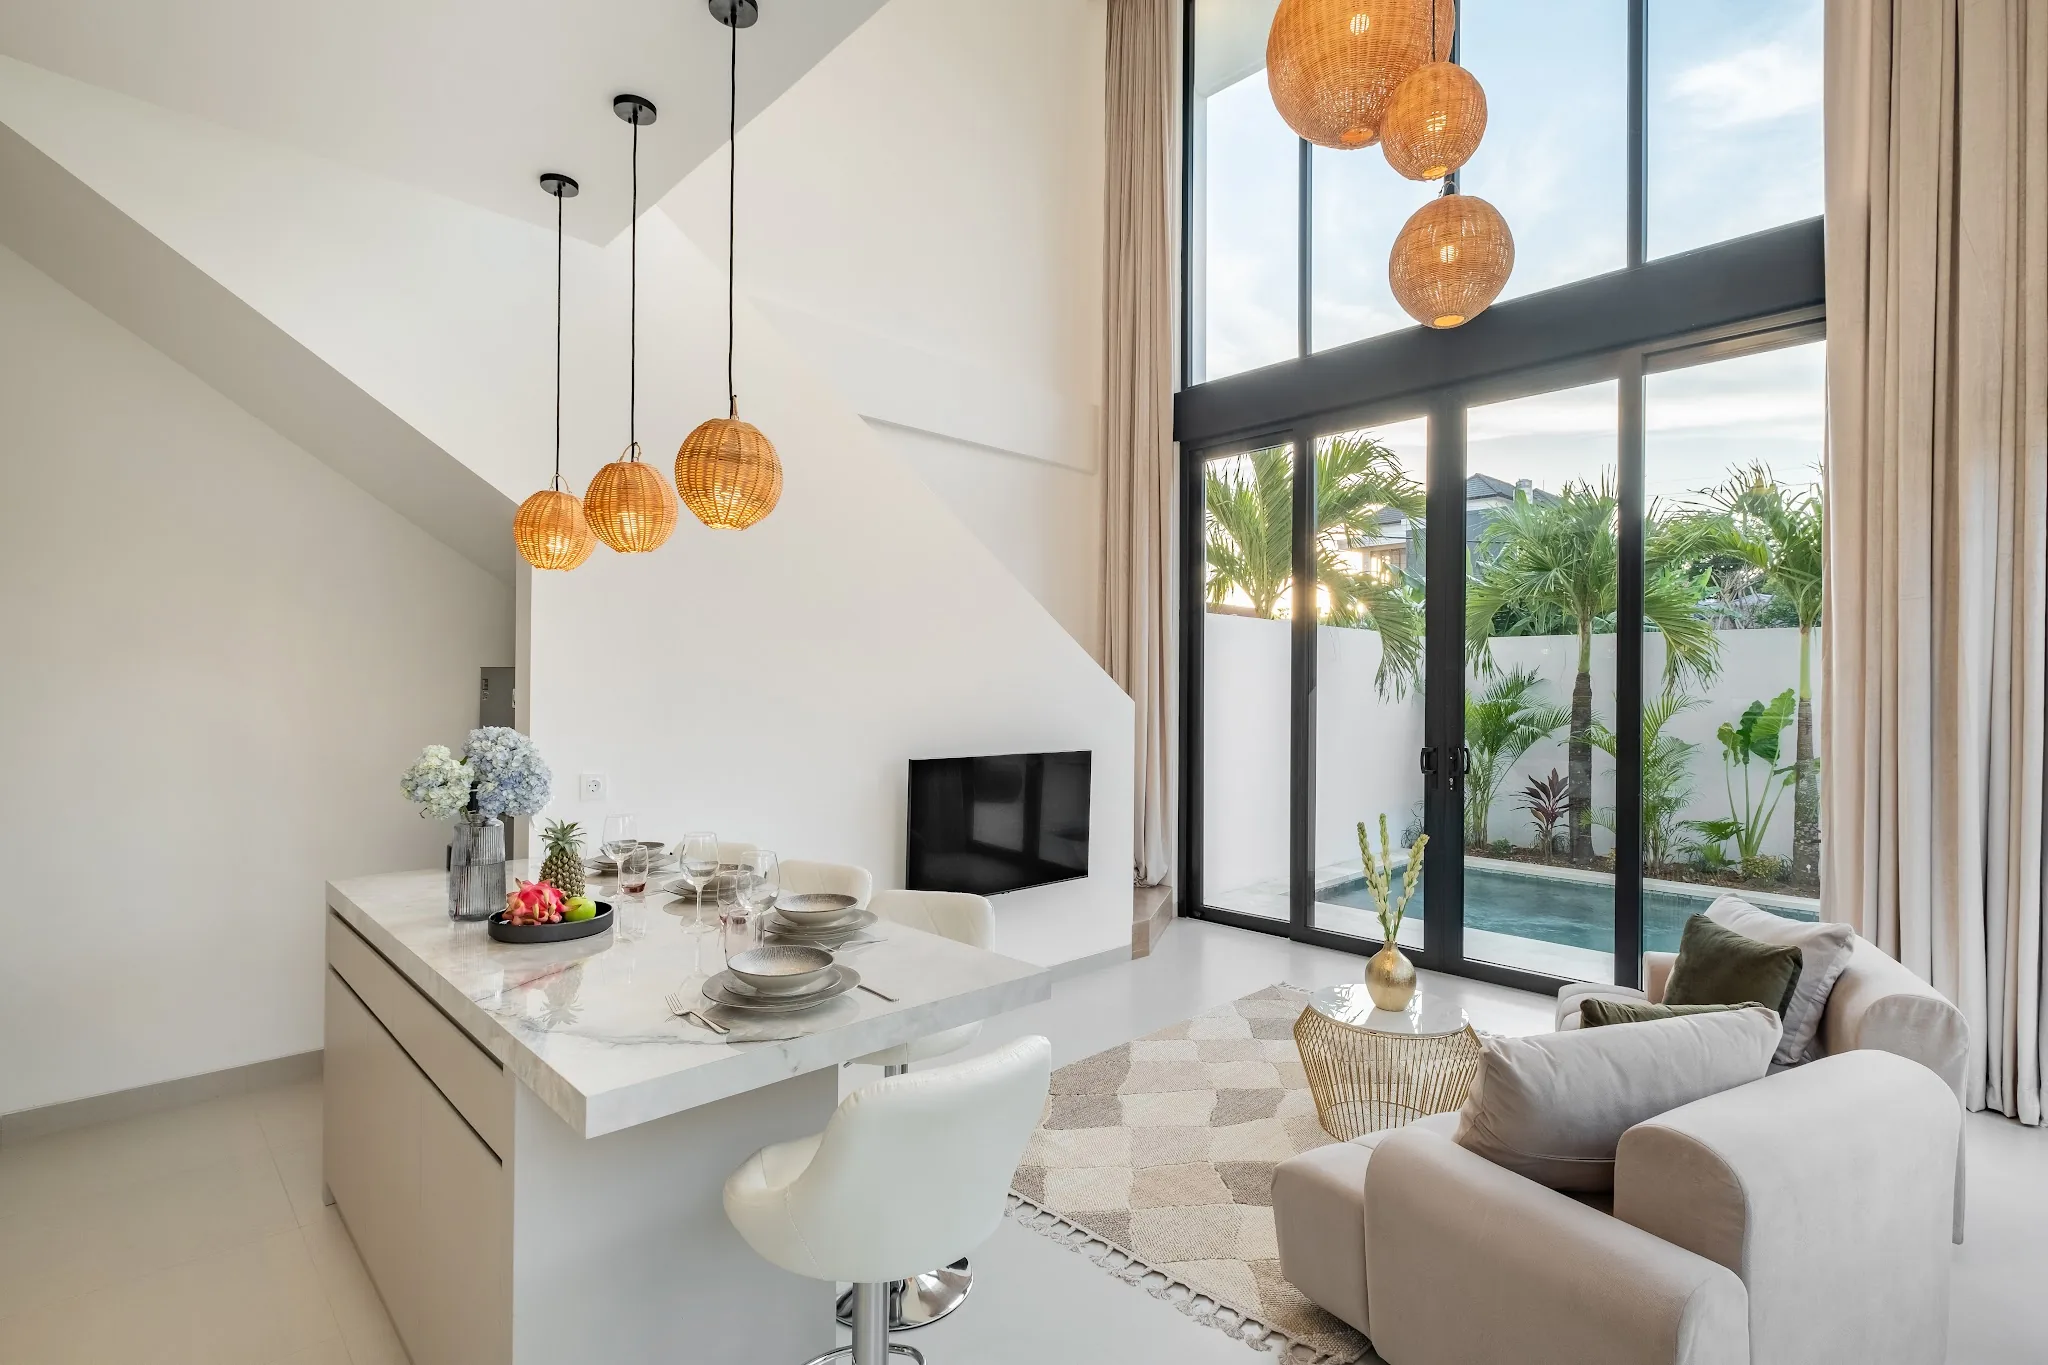
Premium beach residence Canggu
Canggu, Bali
Expertise & Data
Decisions backed by algorithms, not intuition
“We don't believe in 'intuition.' Our algorithms process 37,000 listings weekly to find the assets that actually perform”

Most investors follow the crowd. We follow the logs. While the median market hits a ceiling, our selected assets operate in a different reality
Calculated by Equity Bali Proprietary AI: Analysis of 37,241 active listings
Bali Investment
Analytics Report
Bali Real Estate
Analytics Report 2025/2026
Market trends, zone-by-zone analysis, ROI benchmarks, and regulatory updates. Everything you need to make an informed investment decision in Bali.
- Zone-by-zone yield comparison
- Regulatory & legal landscape update
- Infrastructure development impact map
Strategic Picks
Hand-selected assets that passed our 4-stage due diligence. Each one backed by a clear investment thesis
Berawa 2BR Villa
Berawa, Bali
Building permits in this zone dropped 15% YoY, driving scarcity value for existing assets

Ubud 3BR Villa
Ubud, Bali
New residential community with its own infrastructure: parking, landscaped park area, walking paths and a waterfall

Canggu 2BR Villa
Canggu, Bali
Rising tourist inflows are supporting rental returns of up to 10% for villas in Canggu
Ironclad Legal Foundation
Ownership Structure
Leasehold and Freehold options via PT PMA. We structure each deal for maximum legal protection and tax efficiency for foreign investors
Secure Transactions
We support transactions through licensed escrow partners with transparent audit trails
4-Stage Due Diligence
Title verification, zoning audit, encumbrance check, and independent valuation
Your Property, Our Management
Transparent reporting 24/7. Receipts, occupancy, expenses — all in one dashboard
Full-Service Property Management
Calculate Your ROI
Answer 3 quick questions and get a personalized property selection
What's your primary goal?
Select the objective that best describes your investment focus.